Diagrams Example
There is a plugin for sphinx called sphinx-diagram which adds support for embedding Diagram graphs
in your documents. Diagrams moto is “diagrams as code” since the diagrams are generated from code using graphviz.
There diagrams let you visualize system architecture , here is a quote from the Diagrams README:
Diagrams lets you draw the cloud system architecture in Python code.
It was born for prototyping a new system architecture design without any design tools.
You can also describe or visualize the existing system architecture as well.
Diagrams currently supports main major providers including: AWS, Azure, GCP, Kubernetes, Alibaba Cloud, Oracle Cloud etc...
It also supports On-Premises nodes, SaaS and major Programming frameworks and languages.
One can achieve this by following these instructions:
Make sure
graphvizis properly installed on your machine/environment, for instance it can be installed viacondalike this:conda install -c conda-forge graphviz
Make sure you have the
sphinxplugin fordiagram(installable viapip)pip install sphinx-diagram
Make sure that this plugin would be recognized in your
conf.pyby adding it to theextentionslistNote
In this project the
conf.pyis generated bycmakefrom theconf.py.infile and therefore this addition should be added toconf.py.insince it’s the template file for the generatedconf.py.extentions = [ ... "sphinx_diagrams", ... ]
After those instructions you should be able to add the following directives in your .rst files
.. diagrams::

   import sys
   from diagrams import Cluster, Diagram
   from diagrams.aws.compute import ECS, EKS, Lambda
   from diagrams.aws.database import Redshift
   from diagrams.aws.integration import SQS
   from diagrams.aws.storage import S3

   with Diagram("Event Processing", filename=sys.argv[1], show=sys.argv[2].lower() == "true"):
       source = EKS("k8s source")

       with Cluster("Event Flows"):
           with Cluster("Event Workers"):
               workers = [ECS("worker1"),
                          ECS("worker2"),
                          ECS("worker3")]

           queue = SQS("event queue")

           with Cluster("Processing"):
               handlers = [Lambda("proc1"),
                           Lambda("proc2"),
                           Lambda("proc3")]

       store = S3("events store")
       dw = Redshift("analytics")

       source >> workers >> queue >> handlers
       handlers >> store
       handlers >> dw
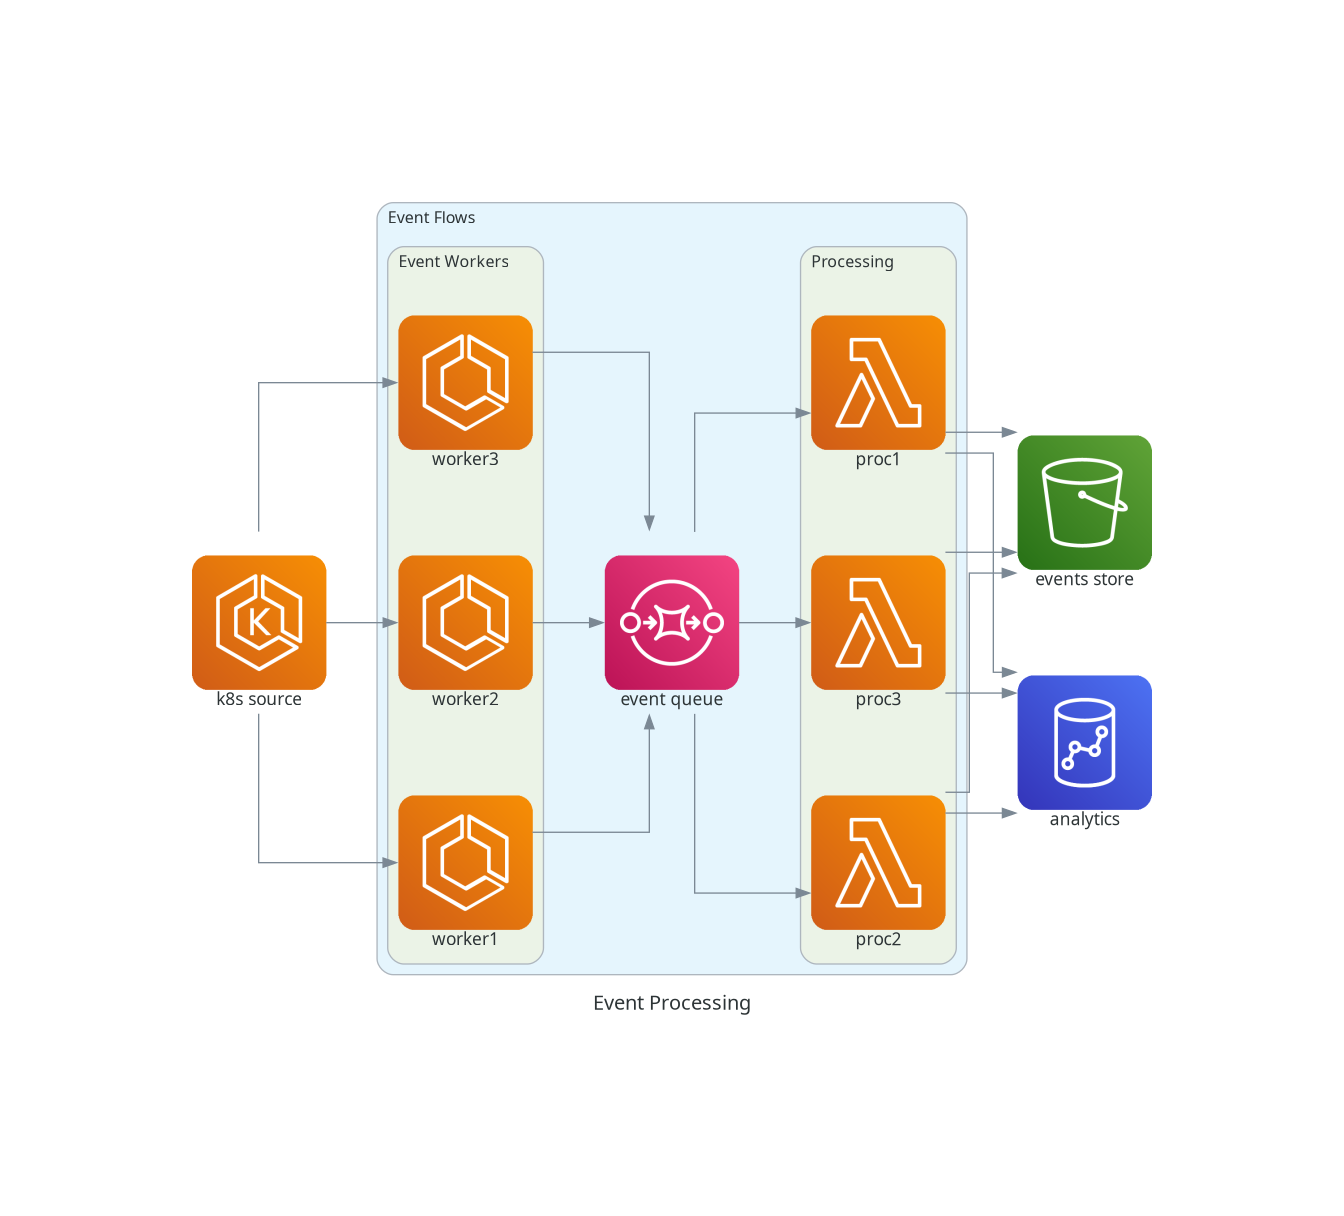
Here is how it looks: